
This article presents a ground-breaking approach to generating survey data for a BIM process offered by the Vercator toolkit. Produced by a UCL spin-out company, Correvate, it touches on the robust automatic registration and smart object recognition technology that the company is developing for downstream analysis.
In order to construct survey- grade 3D models of buildings, roads, railway stations, canals and other similar structures, the 3D environment must be fully recorded with accuracy. Following this, accurate measurements of the dimensions can be made on the recorded 3D datasets to enable 3D model extraction without having to return to the site and in significantly reduced times. The model may be compared to the original design and serves as a digital record of the asset at a given point in time. Laser scanning has become a powerful way of capturing 3D measured data about the built environment. However, the process of registering the point clouds produced from static terrestrial scanning to extract useful information is user-intensive and time-consuming.
The Vercator approach
In the approach adopted by Vercator vectors in overlapping scans are matched and brought into alignment, first to perform rotation alignment, and then translation alignment in the horizontal plane, followed by translation alignment in the vertical plane. In fact, such vectors are calculated and found at every point. Typically there are 10’s of millions of natural targets in each scan compared to the 10’s of artificial targets or natural targets marked by eye in other approaches, resulting in fewer misalignments.
The advantage of the Vercator approach is that the process utilises natural features in the 3D environment as natural targets which are automatically recognised, their location and orientation determined, then represented by feature vectors. A detailed description of the method can be seen below.
Performance
By representing features in the natural environment as vectors, then bringing these into alignment and treating them as natural targets, pairs of overlapping scans can be quickly and reliably aligned. These vectors reduce the number of misalignments to otherwise similar features, resulting in a more reliable and robust method.
The proportion of scans aligning depends on the nature of the 3D scene being scanned, but in trials carried out with 6 datasets ranging from 16 to 129 internal and external building scans, between 87% and 100% of the scans automatically aligned with an accuracy of less than 5mm in under 4.5 hours.
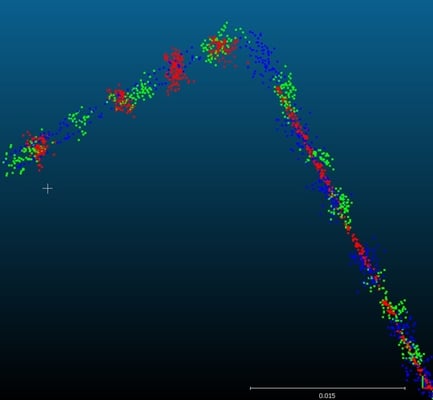
Compared to the technique of using laser scanners and a number of artificial targets, the Vercator method aligns scans automatically, significantly reducing registration time. The time depends on the number of scans and the types of scans; the benefit increasing with the number of scans. So, for 251 scans of a building with corridors, a large hall and a multi-floor atrium with escalators, alignment can be achieved in 10 hours as opposed to 60 hours via conventional methods. Since Vercator is predominantly automatic, this represents an even greater saving in costly operator hours. The alignment accuracy of the Vercator method was within 3.2mm. This figure is within the laser scanner measurement accuracy of ±2mm, so is, at the very least, the state of the art to within the measurement error.
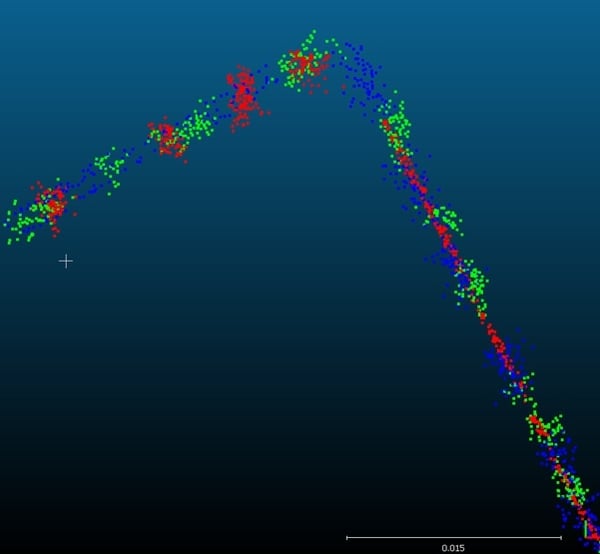 Figure 1. Alignment accuracy of 3 scans - the scale bar is 15mm long
During trials, 105 scans of a complex network of rails, platforms and station buildings were aligned automatically by an experienced operator with the Vercator software in 10 hours as opposed to 2 operators over 10 days, the latter encountering considerable challenges using current semi-automated techniques.
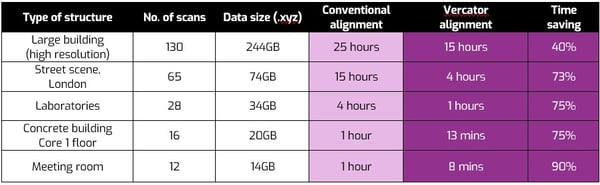
Potential savings are shown in the table below with typical performance indicators for conventional alignment methods, mostly using artificial targets, compared with those of the Vercator Toolkit.
Additional benefits include:
• Reduced preparation: easy to set up without the need for targets
• Automated: registering of overlapping data is automatic
• Robust: targets are eliminated minimising mis-identification
• Quality: equals current industry workflow standards and reports
Automatic object detection and artificial intelligence
Once multiple 3D point cloud scans have been precisely registered using the Vercator approach downstream data analysis is more readily achievable. One form of downstream analysis is automatic recognition of 3D objects. Automatic object detection can be based on finding features that match primitive shapes, e.g. planes, edges, cylinders. This process involves segmenting or classifying the point cloud into geometrically separate elements and then recognising them for 3D geometry model creation or extraction. This method is effective for simple elements that occur often, such as pipe cylinders in industrial plants, but is less useful when the object complexity or variability increases.
Artificial Intelligence (AI) in the form of Machine Learning (ML) provides an effective approach to these more complex cases. ML is the “ability to learn without being explicitly programmed”, requiring many types of both wanted and unwanted objects to build the ML model. Correvate, in partnership with UCL, has been researching ML in relation to point cloud object extraction. Artificial Neural Networks (ANN) have existed for around 50 years as a technique and are very loosely based on the way real neural networks work in the brain, with neurons voting on the outcome.
Deep Learning extends this with unsupervised learning, i.e. letting the model teach itself which features are significant. Higher level features are derived from lower level features to form a hierarchical representation.
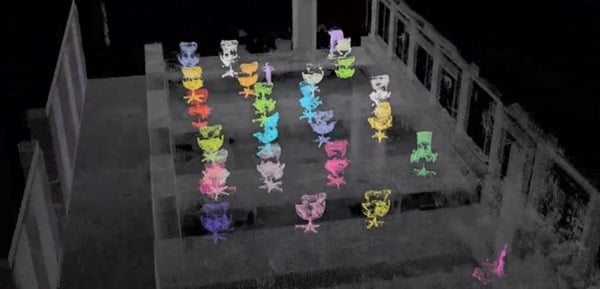
Figure 2. Chair recognition from point clouds using deep learning
Figure 2 shows this approach used with chair data. The model was given point clouds of various types of chair to ‘learn’. It was then provided with a point cloud of an office, where the model detected the vast majority of the chairs in the scene, including those that were only partially captured.
A change agent
A method which provides high- speed, robust, automatic alignment of hundreds of 3D point cloud laser scans paves the way for new working methods. The Vercator toolset lowers barriers to capture data onsite, speed of alignment, and convenience of downstream analysis. This ready availability of up- to-the-minute verifiable information is certain to improve many aspects of construction. In future, all buildings and structures may be scanned during construction and renovation, resulting in the ability to correct construction errors on a day-to-day basis. Further, with emerging techniques for recognising and ‘extracting’ complex objects, the benefits of the Vercator approach will also be enjoyed by downstream users of the datasets, in asset management for example.
Details of the method
Consider the natural features and targets to be small flat elemental areas, because many 3D environments being scanned have such features. Each flat element is represented by a vector direction, which is either normal or at right angles to each small flat plane, but its length is normalised to one. We can then draw these ‘surface normal vectors’ as small arrows starting at each point and pointing away from it, as shown in figure 3.
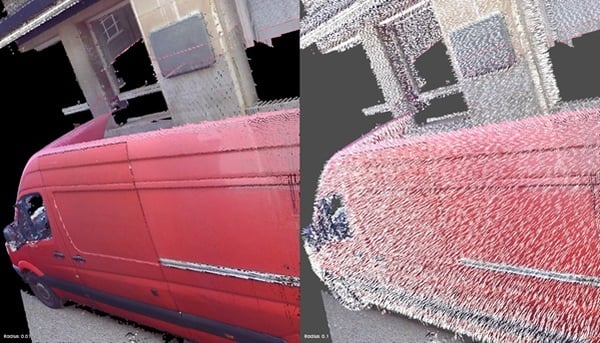 Figure 3. Surface normal vectors
Rotational alignment
Now imagine that each vector is lifted away from where it is, but maintains its direction and is moved so that its tail lies at the origin of a new space. All of the surface normal vectors have the same length so their arrow tips will lie on the surface of a sphere, as shown in figure 4. A pattern is created on the surface of the sphere. For example, a wall will have many surface normal vectors, all of which will be represented on the surface of the sphere, roughly at the same place since the surface normal will be generally parallel. This is carried out for each overlapping scan giving the sphere its own pattern for each scan. Now if the scans have sufficient overlap the resulting patterns will have many similar features. So, by moving the origin of the sphere for one scan to coincide with the origin of the sphere for an adjacent overlapping scan, we nest two spheres inside one another. Then we only have to rotate one sphere relative to the other until the two patterns match in order to obtain the angles we need to rotate one scan to bring it into alignment with the other scan. If the horizontal is known, it is only necessary to perform a rotation about a vertical axis until the two patterns match.
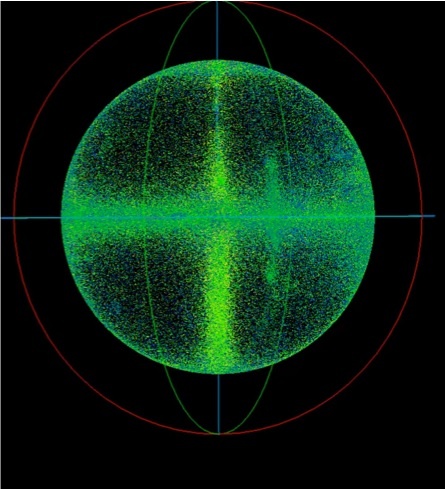 Figure 4. Vectors represented on the surface of a sphere
Horizontal translation alignment
To determine how much horizontal movement the scans require, the point cloud scans are projected, collapsed or squashed onto the horizontal plane to form a 2D plan view, figure 5. When the points collapse onto the plane, vertical walls which have millions of points on them will collapse to form a line on the plane. This creates a point density image. These 2D plan view images have already been rotated to have the same angular rotational alignment, so all that is necessary is to slide the image for one scan over that of the adjacent scan, then to calculate the degree of match to find the position of best alignment. The degree of match calculation takes into account the density of points.
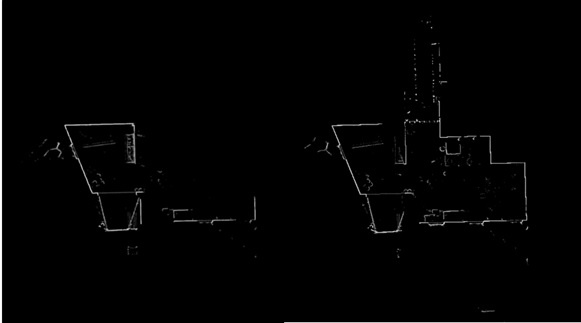 Figure 5. Horizontal alignment on the horizontal plane
Vertical translation alignment
To find the vertical shift or translation, the point clouds of the two scans are separately projected, collapsed or squashed onto a vertical rod, figure 6. Flat floors with millions of points on them collapse to very high densities of points on the rod, and similarly with flat ceilings. The point density pattern of one scan is slid over the point density pattern of the other scan to obtain the position of best match, which indicates how far one scan must be moved to bring it into alignment with the other scan. To ensure a flat horizontal floor in one scan aligns to a flat floor in the overlapping scan and not to a flat horizontal ceiling, the surface normal direction is retained in the process of collapse. Since all floor points have surface normal vectors pointing up and all ceiling points have surface normal vectors pointing down, the floor can be distinguished from the ceiling and only matched to points with surface normal vectors pointing in the same direction.
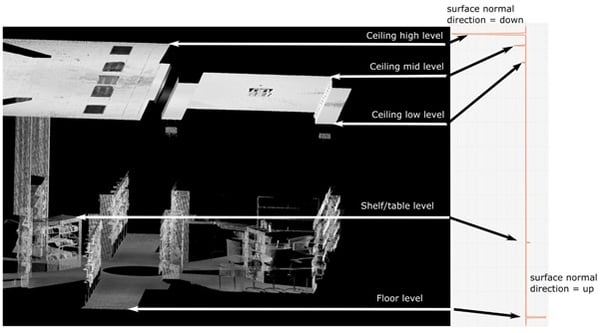 Figure 6. Vertical alignment on a rod
Acknowledgements
The author wishes to thank Eero Willman+, Charles Thomson+, Hadi Baghsiahi*+, Jifang Duan*, Jiayu Pan*, Mike West+, David Gray, Roger Maran+ for their contributions. (*UCL, +Correvate).
About the author

David Selviah is both a UCL academic at Reader level and CTO of Correvate Ltd, a UCL spin-out company commercialising his 3D point cloud processing research. For the last 31 years he has been at the Department of Electronic and Electrical Engineering, University College London (UCL) where, apart from his research on AI and creative algorithm development, he has specialised in the laser and optical field including LiDAR scanning. He has over 200 publications in his academic career to date. .png?width=1488&name=Correvate%20CTA%20(1).png)
Tags: point clouds
